

Blogs

Date 29 June 2026
Very often while running performance tests, you might notice issues around memory which could impact various areas of the system under test and also impact the end user. In a .Net environment memory leaks are a very common issue seen while developing and testing software. When working in a managed environment, memory leaks are less common because the Garbage Collector usually takes care of the memory. Memory leaks are more likely to happen when unmanaged code is used as it is outside the CLR.
This article shows how to use free tools available to generate a memory dump and analyse it. Please note that this example is from a Windows 2003 server; in later versions of windows, memory dumps can be generated simply by selecting the process from Windows Task Manager and selecting the ‘Create Dump File’ option.
Creating Memory Dumps
- Download procdump from http://technet.microsoft.com/en-gb/sysinternals/dd996900.aspx
- Extract contents of the Zip file and you will find an executable called ‘procdump.exe’
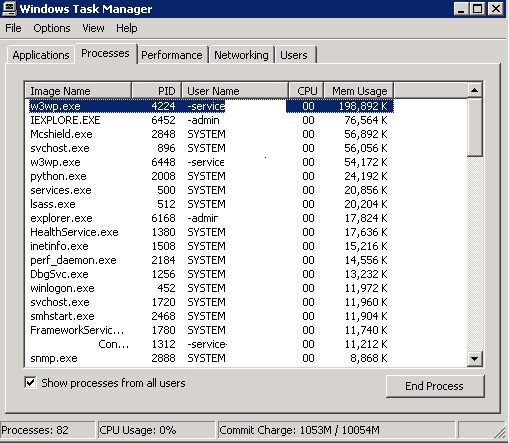
- Find the process ID of the process from which you want to take the memory dump
- This can be done by opening windows task manager; for example from the screenshot below we want to create a memory dump of the w3wp process which has 4224 as the process ID

- This can be done by opening windows task manager; for example from the screenshot below we want to create a memory dump of the w3wp process which has 4224 as the process ID
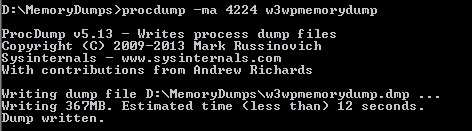
- Open a command prompt window and navigate to the directory where you extracted procdump and type the following command:
Analysing Memory Dumps
- Download and Install Debug Diagnostic Tool from here http://www.microsoft.com/en-gb/download/details.aspx?id=26798
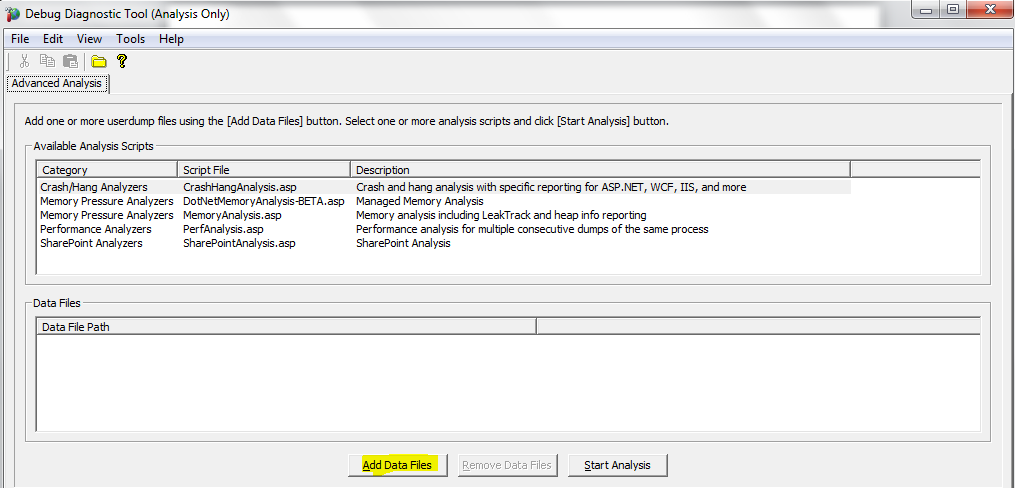
- From the Debug Diagnostic Tool installation folder or the start menu, open ‘Debug Diagnostic Tool (Analysis Only)’ and click on ‘Add Data Files’ from the open window

- Navigate to the folder where you have memory dump saved and open it. It will then add it in the Data Files list.
- There are different types of analysis that can now be performed on this memory dump. For example: Crash/Hang Analysis, Memory Pressure Analyzers, etc..
- As an example we will try to analyse the DotNetMemory, select the 2nd line from the analysis scripts window and click on ‘Start Analysis’
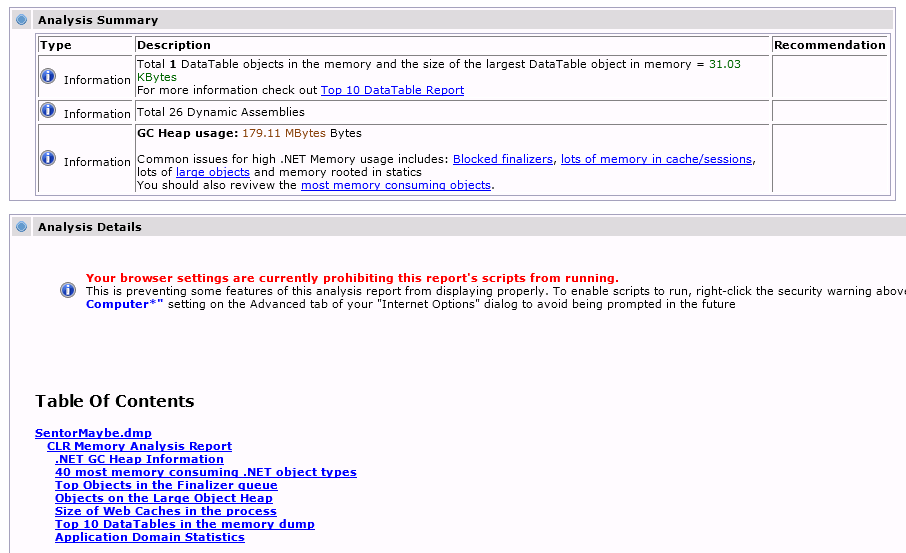
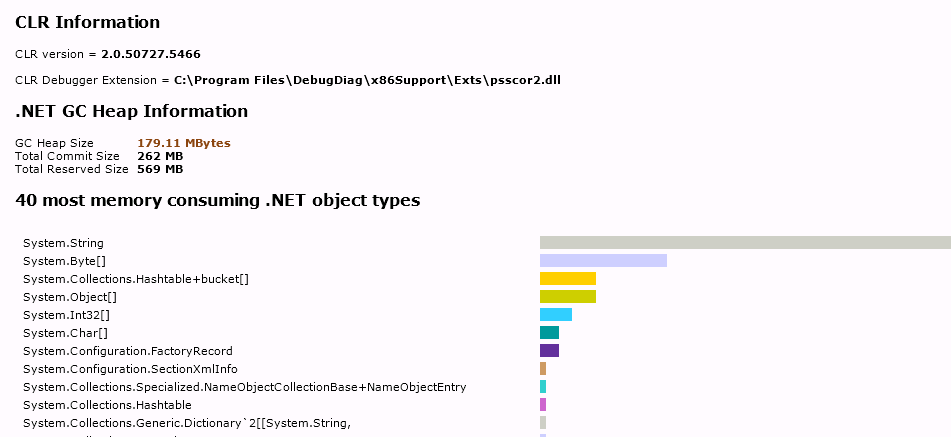
- After a few seconds a new tab will appear in your internet browser that will look like the screenshots below. You can browse through the page to view memory contents, objects stored in memory and various other metrics that will help in troubleshooting performance issues.

About the author
Team Capacitas

FinOps and AI: Building the Financial Discipline for the Next Wave of Enterprise Intelligence
AI FinOps represents an evolution rather than a replacement of traditional FinOps. It extends the model into a domain where financial, technical, and product decisions are tightly interconnected.

Confidence Under Load: How We Verified AKS Readiness for Peak
How Capacitas verified AKS readiness for peak demand by validating workload performance, autoscaling, cluster capacity, monitoring, and incident response.

Building Cloud Resilience: Lessons from the AWS Outage
Learning from the Latest Outage. Events like this week’s AWS disruption highlight one clear truth: resilience must be designed, not assumed.

Bringing Order to Chaos: A Practical Guide to Chaos Testing in the Cloud
In today’s cloud-native environments, resilience is not optional—it’s critical. Chaos testing has emerged as a key practice for validating system behaviour under failure conditions.

