

Blogs
Date 09 May 2013
Have you ever wondered how to determine the impact of consolidation across your data centres? This blog covers a simple exercise on answering this question for a real customer.
A study was conducted for one of our clients involving servers at three of their data centres in X, Y and Z. The purpose was to find out whether the Data centres X and Y could accommodate the load from Data centre Z.
The first step in any modelling exercise is data collection. We had the following 2 weeks' data:
- CPU, Memory, Network and Disk utilisation and performance data collected using Cacti (This was the web-based monitoring and reporting tool in place)
- Page Size data
- Weekly unique visitors data
From previous analysis we were aware that this data was fairly representative, but beware of annual seasonality in your own environments!
Now that we had the data needed, we performed regression analysis between the service demand data (Page Size and Weekly unique visitors) and the component data separately. This analysis identified a very strong correlation between all three data centres using R2, in particular CPU and Network. Analysis showed that CPU usage had the highest importance; therefore it is this performance metric that we will focus on in this study.
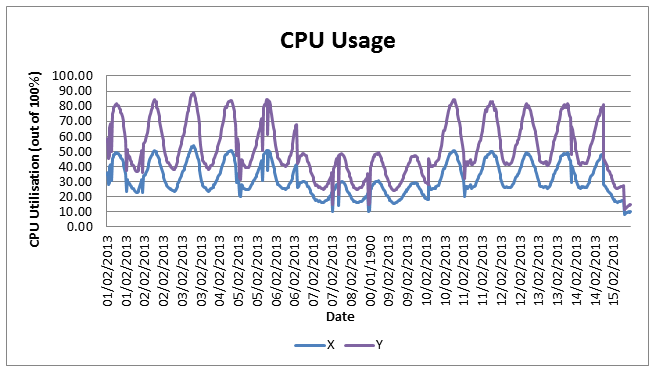
The chart below shows the predicted CPU utilisation if we were to consider the service demand across all data centres to be at one particular data centre; either X or Y. To calculate this for Y for example, we used the following formula: (Total service demand * gradient + intercept) + No. of standard errors * standard error value. This gave us an idea of how much CPU would be utilised. As you can see, the CPU usage would be more at the Y data centre than X, but the good thing is, complete utilisation has not been reached. The gradient, intercept and standard error values were calculated using existing Excel functions, along with our collected component and service demand data.

This is a way of consolidating service data from across a number of data centres - the same process can be used for other metrics too.
So what can we conclude about the capacity at X and Y data centres with Z load on top? From looking at CPU utilisation only, there is ample capacity for more demand, especially at X.

About the author
Team Capacitas

FinOps and AI: Building the Financial Discipline for the Next Wave of Enterprise Intelligence
AI FinOps represents an evolution rather than a replacement of traditional FinOps. It extends the model into a domain where financial, technical, and product decisions are tightly interconnected.

Confidence Under Load: How We Verified AKS Readiness for Peak
How Capacitas verified AKS readiness for peak demand by validating workload performance, autoscaling, cluster capacity, monitoring, and incident response.
Building Cloud Resilience: Lessons from the AWS Outage
Learning from the Latest Outage. Events like this week’s AWS disruption highlight one clear truth: resilience must be designed, not assumed.
Bringing Order to Chaos: A Practical Guide to Chaos Testing in the Cloud
In today’s cloud-native environments, resilience is not optional—it’s critical. Chaos testing has emerged as a key practice for validating system behaviour under failure conditions.

