

Blogs
Date 29 June 2026
In part 2 of the 'tools to help diagnose performance issues' series, I will be taking you through some basic Wireshark tips to help you diagnose network performance problems.
Wireshark is a very powerful network analysis tool. It allows you to capture all traffic on an interface and display them how you want by using filters.
With filters you can very easily zoom in to where you think the problem may lie. For example, you can filter out all the ARP broadcasts, DNS queries and other traffic which you may not find of importance.
Tip #1 - Use Filters
Usually when I suspect a problem on the network layer, I filter by source and destination IPs. So for example, if I am running a test from server A which is hitting web server B, I will filter by source and destination IPs of server A by using an OR operator. This will give me all the traffic going from A and all the traffic coming to A.
ip.src == 1.1.1.1 || ip.dst == 1.1.1.1
In the above filter, ip.src is the source IP, ip.dst the destination IP and the || means OR. So, if src is 1.1.1.1 OR dst is 1.1.1.1 THEN display in the filtered list.
Another useful way of filtering is to do it by protocol. For example, typing http || ssl in the filter bar will immediately cut down the filtered list to just HTTP and SSL traffic.
Example #1
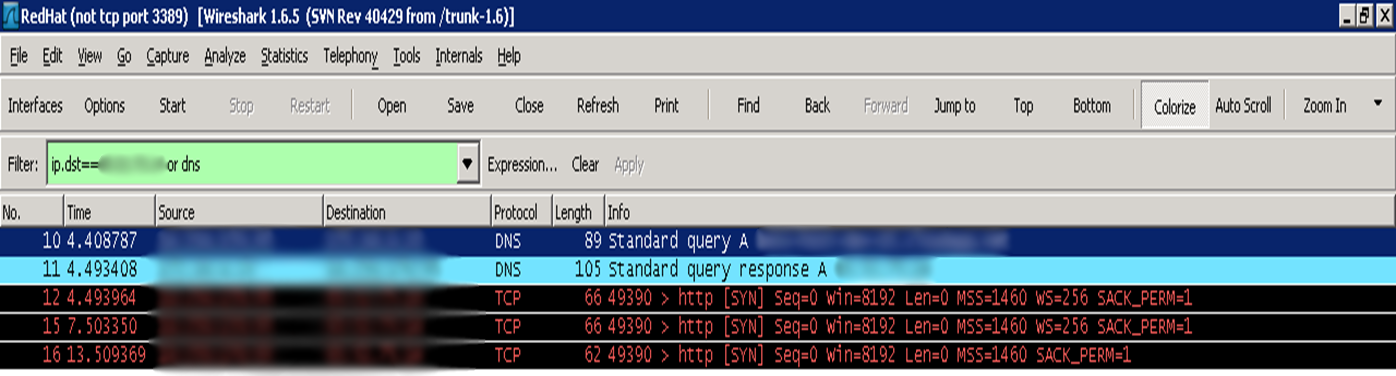
In the example below, I have filtered against the load injector server (the server that is throwing load against the test servers). Here you can see that the injector keeps trying to send a SYNchronise message to the web server but the web server is not replying back to it with a SYN-ACKnowledge. After logging in to the server, we checked the configuration and found that the IIS web-site was in the stopped state.
 SYN but no SYN-ACK?
Tip #2 - Sort list by time since previous displayed packet
It is very useful for us performance testers to know the time differences between the sent and received packets. By default, Wireshark will show the time per packet from the last captured packet. The reason we don't like that is if we have a filtered list, the time column becomes a lot less useful to us. What we would like to see is the time based on the last displayed packet. This gives us the time in the filtered context. This will make more sense in the example below.
To set the time display from last displayed packet, select View -- Time Display Format -- Seconds Since Previous Displayed Packet
Example #2
In the example below .250 is the load injector and .230 is the web server.
The highlighted row is the one of interest. Notice the 72 second delay in the time column. According to the filter, that is 72 seconds from the last communication point of the two servers.
If the time was set to display since last captured packet, we wouldn't have seen that - instead we would have seen a number in the miliseconds - out of our filter context.
 Time since last displayed packet - 72 seconds
If you're interested, the 72 second delay ended up being the cause of a very inefficient store procedure being called on the database. Find out more on SQL performance tools in the next series of this exciting journey of performance diagnosis tools :)
Look out for the next part of the Performance Diagnosis Tools series! Follow the series by clicking here, on Twitter or subscribe to the Capacitas blog (on the right!) to get the latest info.

About the author
Team Capacitas

FinOps and AI: Building the Financial Discipline for the Next Wave of Enterprise Intelligence
AI FinOps represents an evolution rather than a replacement of traditional FinOps. It extends the model into a domain where financial, technical, and product decisions are tightly interconnected.

Confidence Under Load: How We Verified AKS Readiness for Peak
How Capacitas verified AKS readiness for peak demand by validating workload performance, autoscaling, cluster capacity, monitoring, and incident response.
Building Cloud Resilience: Lessons from the AWS Outage
Learning from the Latest Outage. Events like this week’s AWS disruption highlight one clear truth: resilience must be designed, not assumed.
Bringing Order to Chaos: A Practical Guide to Chaos Testing in the Cloud
In today’s cloud-native environments, resilience is not optional—it’s critical. Chaos testing has emerged as a key practice for validating system behaviour under failure conditions.

