

Blogs
Date 29 June 2026
In this series of short blog articles, I will discuss some freely available tools you can use to diagnose and resolve performance issues with your applications & servers.
In Part 1 of the series is a widely used and popular tool called ProcMon (also known as Process Monitor).
ProcMon can help diagnose some major performance problems very quickly and easily by listing (in real time) detailed file, network and registry activity on the screen per a particular process.
The best way to demonstrate the power of the utility is to show an example:
Example - Web Server IIS Logging
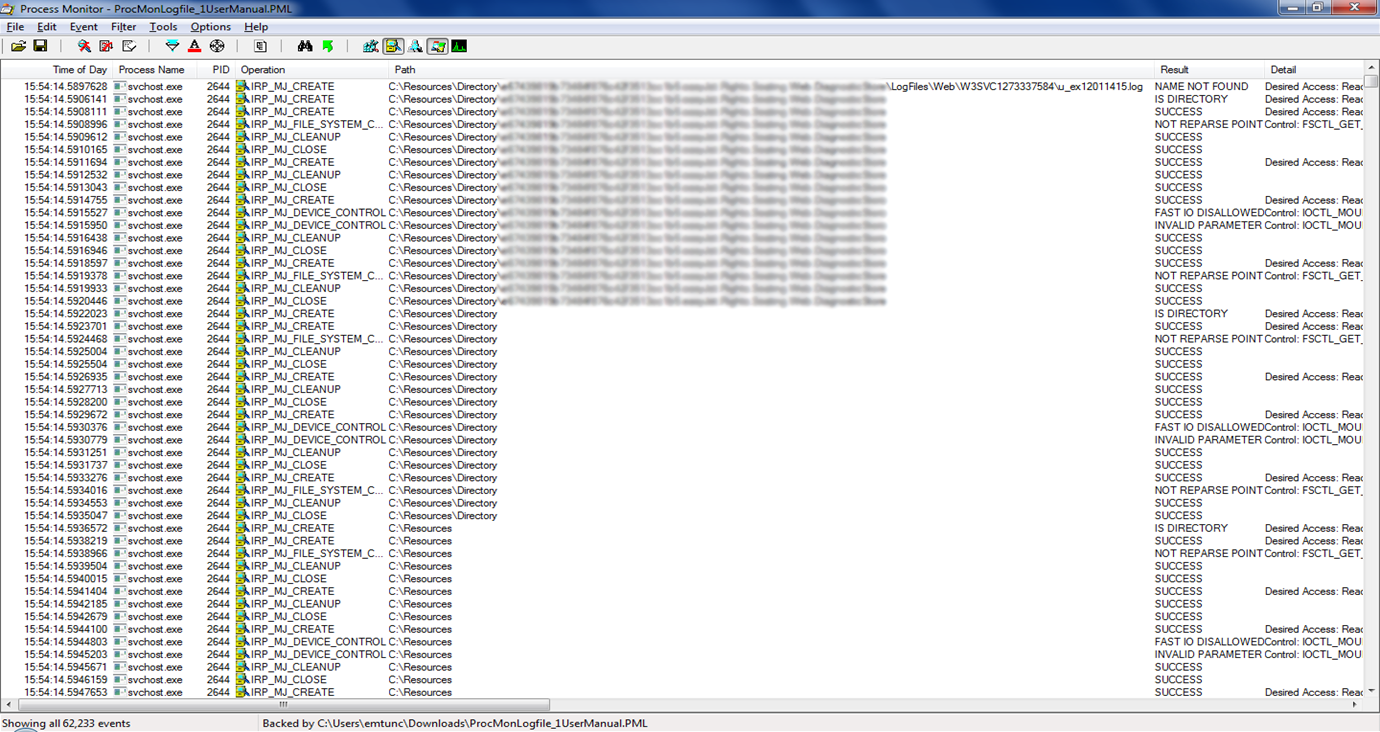
I was working on a project a while back actively performance testing Azure cloud web servers, using JMeter. During our tests we noticed transaction throughput drops and maxed out CPU utilisation on all of the web boxes. After capturing a few minutes worth of ProcMon data, I immediately saw the problem to be the svchost process writing to a .log file in a folder with the prefix 'W3SVC' - from experience I know this to be IIS logging activity.
 ProcMon - IIS Logging Activity
As you can see from the screen shot, there's a lot of read/write/open activity on the log directory. What you can't see is that almost all of the 62k events (bottom left figure) are associated with the IIS logging directory.
After turning IIS logging off on the server, the tests ran fine and utilisation was back down to normal levels.
Our client ended up filing a ticket to the Microsoft Azure team regarding the issue as this was not expected behaviour.
Another plus about ProcMon is that you can export the logs to a .PML format which gives you the full viewing ability later on (the above is a .PML extract which I then viewed on another machine). There is also the ability to export to .CSV however personally I found the .PML export a lot more useful (the .CSV export is a lot more limited in information provided).
Look out for the next part of the Performance Diagnosis Tools series! Follow the series by clicking on Twitter or subscribe to the Capacitas blog (on the right!) to get the latest info.

About the author
Team Capacitas

FinOps and AI: Building the Financial Discipline for the Next Wave of Enterprise Intelligence
AI FinOps represents an evolution rather than a replacement of traditional FinOps. It extends the model into a domain where financial, technical, and product decisions are tightly interconnected.

Confidence Under Load: How We Verified AKS Readiness for Peak
How Capacitas verified AKS readiness for peak demand by validating workload performance, autoscaling, cluster capacity, monitoring, and incident response.
Building Cloud Resilience: Lessons from the AWS Outage
Learning from the Latest Outage. Events like this week’s AWS disruption highlight one clear truth: resilience must be designed, not assumed.
Bringing Order to Chaos: A Practical Guide to Chaos Testing in the Cloud
In today’s cloud-native environments, resilience is not optional—it’s critical. Chaos testing has emerged as a key practice for validating system behaviour under failure conditions.

