

Blogs
Date 29 June 2026
Operational Capacity Management (OCM) is a discipline that deals with the day-to-day management of IT systems. Typically focussed on infrastructure rather than business processes there are many metrics and statistics that can be used to characterise the behaviour of a server without necessarily understanding the business use of that server.
Alerts based on high CPU utilisation are commonplace but often by the time a threshold breach is alerted an incident has already happened.
A simple way to characterise a type of behaviour that can assist in pro-actively avoiding incidents is using a ‘moving minimum’.
Moving Statistics
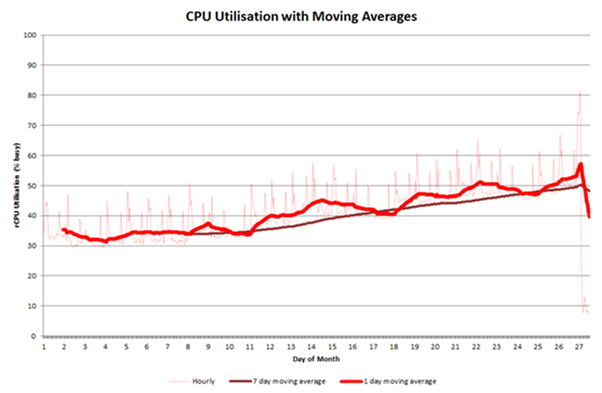
Moving averages are commonly used to smooth data. The graph below shows hourly CPU utilisation data and two moving averages, one day and seven days.
The longer the period that the moving average is applied the smoother the line (the 7 day moving average shows less extreme peaks and troughs than the 1 day moving average). In this case the 7 day moving average shows a steady growth while the 1 day moving average suggests a more step style increase. The original hourly data is difficult to analyse due to the large variations from point to point, however the minimum utilisation shows two interesting points:
- There appears to be a step increase
- The minimum is high and getting higher (suggesting a loop or similar)

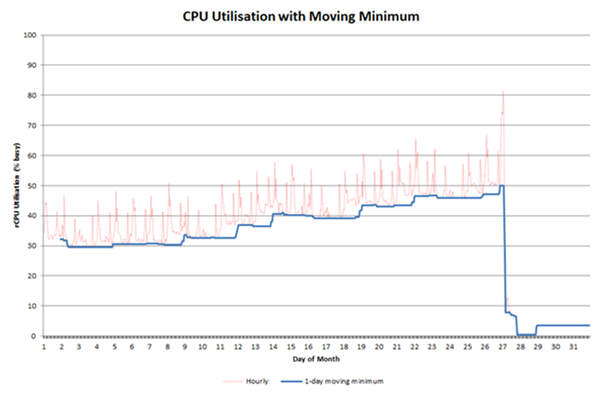
This can be made clearer by applying a moving minimum. The graph below includes a 1-day moving minimum. It clearly shows the stepwise increase and also highlights the fact that the minimum is always high and getting higher (possibly due to one or more processes looping).
The application running on this server failed (illustrated by the sharp fall in CPU utilisation). The root cause of the failure is unknown but it is thought to be due to the eventual high CPU utilisation just before the failure.
The application was restarted on another server and the CPU utilisation was as shown in the graph below.

The observations to make here are:
- The utilisation is much lower than on the original server
- There is a step change in the utilisation
- The minimum is increasing
The conclusion to draw here is that there is something causing the utilisation to step up and this may be on-going such that an incident is likely to occur as before.
In practice this analysis has proven useful to problem managers in that they are now actively monitoring the utilisation of the new server in order to predict when a similar failure might happen. Even without understanding the root cause the server could be restarted in order for the CPU utilisation to drop back down to what is regarded as the appropriate utilisation.
The fact that the minimum utilisation is so high and consistently high suggests that an investigation into which processes are causing this should be undertaken.
Summary
A moving minimum utilisation statistic is able to identify and characterise increases in CPU utilisation. While this can be done by other means (e.g. moving average or moving maximum) using moving minimum also highlights the fact that there is a potential loop.
When these behaviours are recognised and acted upon early incidents can be avoided.

About the author
Team Capacitas

FinOps and AI: Building the Financial Discipline for the Next Wave of Enterprise Intelligence
AI FinOps represents an evolution rather than a replacement of traditional FinOps. It extends the model into a domain where financial, technical, and product decisions are tightly interconnected.

Confidence Under Load: How We Verified AKS Readiness for Peak
How Capacitas verified AKS readiness for peak demand by validating workload performance, autoscaling, cluster capacity, monitoring, and incident response.

Building Cloud Resilience: Lessons from the AWS Outage
Learning from the Latest Outage. Events like this week’s AWS disruption highlight one clear truth: resilience must be designed, not assumed.

Bringing Order to Chaos: A Practical Guide to Chaos Testing in the Cloud
In today’s cloud-native environments, resilience is not optional—it’s critical. Chaos testing has emerged as a key practice for validating system behaviour under failure conditions.

